

Here’s what your data is probably hiding.
COMING SOON

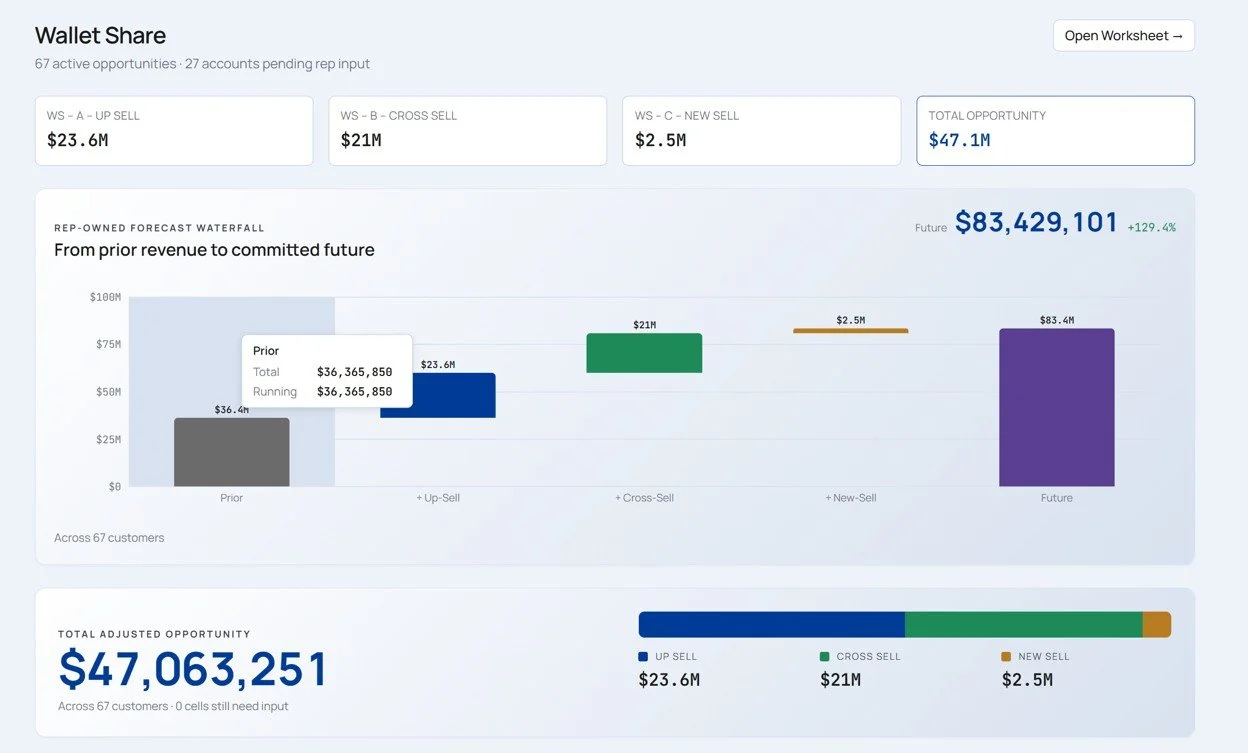
SOAR Elevate Wallet Share
Most middle-market companies know their customers could buy more — but they've never seen a dollar figure attached to that intuition. The Wallet Share module changes that. It takes your sales history and asks each rep to estimate what their accounts spend with other suppliers in your category, then calculates the gap between what you're capturing today and what's realistically available. The result is a rep-owned forecast waterfall that shows the path from current revenue to total addressable opportunity — by account, by product category, and by rep. In this example, a $36.4M revenue base has $47.1M in identified expansion opportunity: $23.6M in up-sell, $21M in cross-sell, and $2.5M in new product introductions.

The question the Wallet Share analysis answers:
Which of my existing customers could be buying significantly more from me — and exactly how much is that worth?
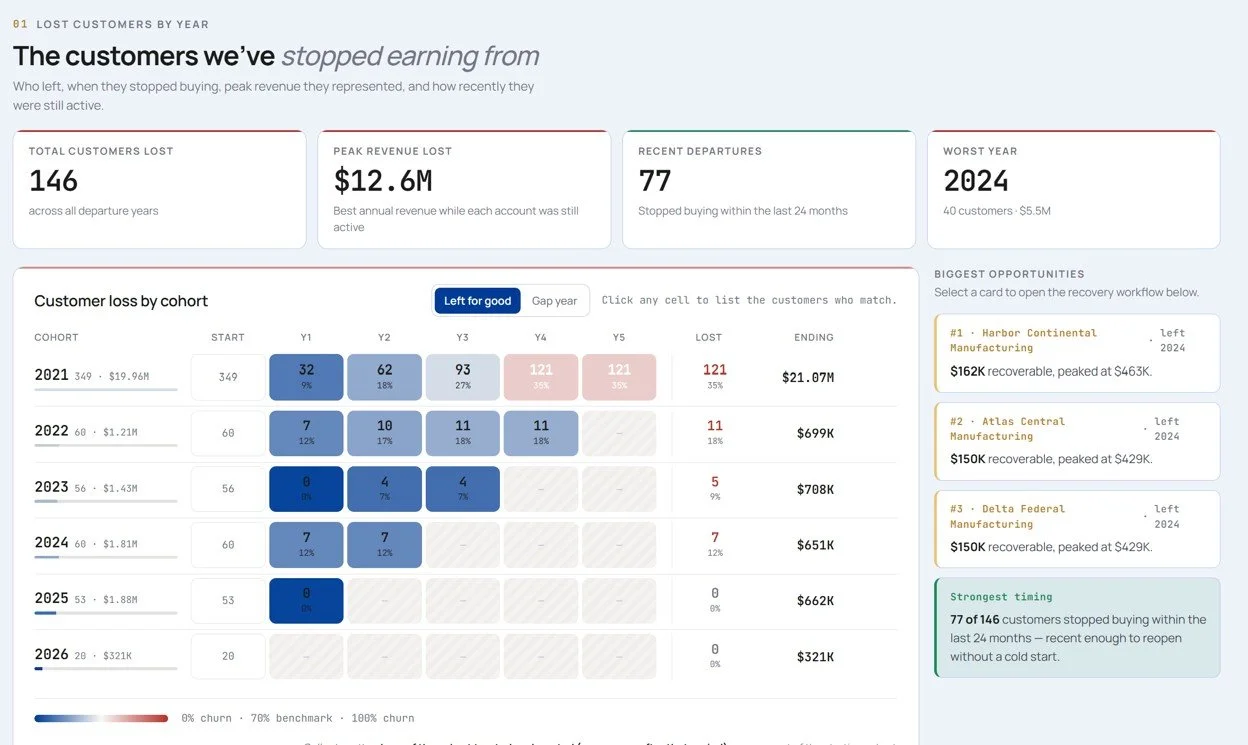
SOAR Elevate Churn
Less than 10% of middle-market companies can readily answer the question: "How many customers have we lost?" SOAR Elevate answers it precisely — and goes further, ranking lost accounts by their recovery potential. The cohort table shows every departed account grouped by the year they stopped buying, with their peak revenue, churn progression, and whether they left recently enough to re-engage without starting from scratch. In this example, 77 of 146 lost customers stopped buying within the last 24 months — recent enough that the relationship is still warm. The platform identifies the top recovery targets with estimated recoverable revenue, giving your team a prioritized win-back list instead of a vague mandate to "go get old customers back."

The question the Churn Analysis answers:
Which lost customers should we call this quarter — and what is realistically recoverable?
SOAR Elevate Hunters and Farmers
Most sales performance problems aren't hiring problems — they're placement problems. A natural hunter placed in an account management role will underperform not because they lack talent, but because relationship-building and patient account growth runs against how they're wired. The same is true in reverse: a skilled farmer expected to cold prospect will struggle, burn out, and underperform.
SOAR Elevate's sales role alignment analysis looks at each rep's actual activity patterns, revenue mix, customer tenure trends, and performance relative to their role definition and then identifies where the fit is strong and where it's costing the business. The output is a clear picture of which reps are in the right seats, which are mismatched, and what a restructured team could produce. Leadership teams use this view not to judge individual reps, but to make smarter decisions about role design, territory assignment, and where to focus coaching versus where to consider structural change.
Hunters & Farmers Sample Report Coming Soon
The question the Hunters and Farmers analysis answers:
Do I have the right people in the right roles — and if not, what is that misalignment costing me in revenue I'm not seeing?
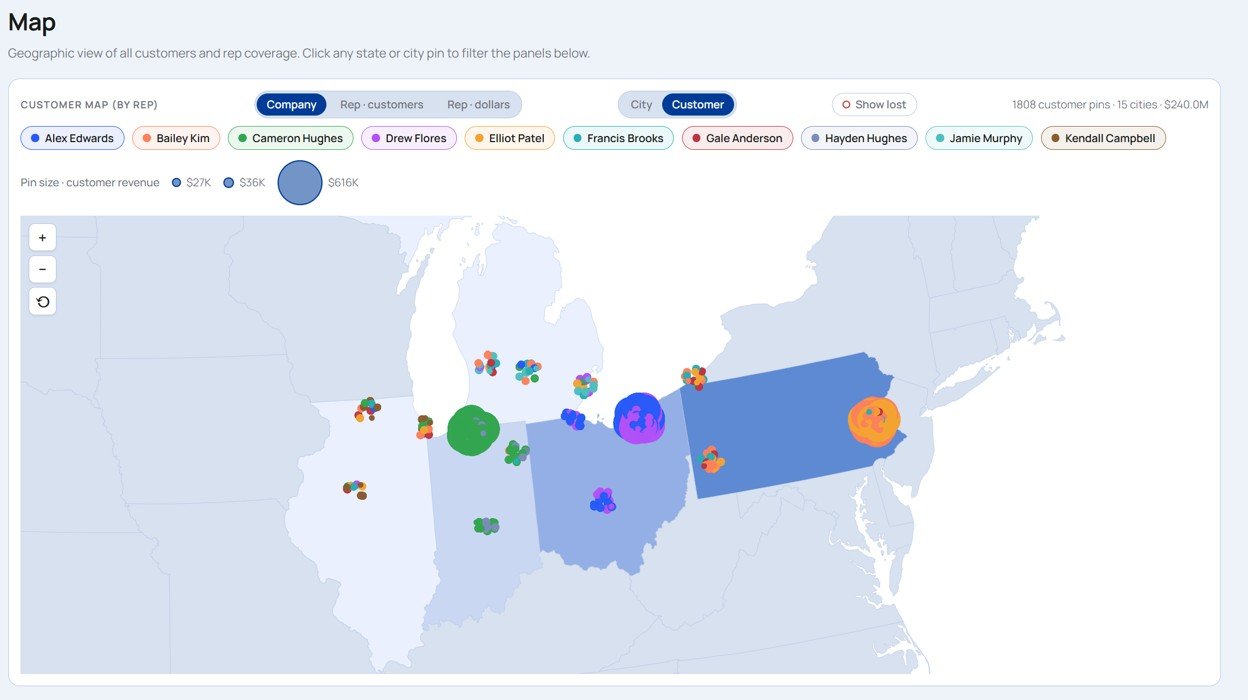
SOAR Elevate Growth Lever* - Geographic Coverage
The geographic map turns your customer list into a visual territory analysis. Every customer is plotted by location, with bubble size representing revenue and color representing the assigned rep. At a glance, leadership can see where revenue is concentrated, where coverage is thin relative to customer density, and where adjacent markets have no coverage at all. In this example, the map immediately reveals a concentration of large accounts in Ohio and Pennsylvania with lighter coverage further west — and a handful of high-value customers assigned to reps who are geographically far from them. These patterns are invisible in a spreadsheet. On a map, they're obvious in seconds. Leadership teams use this view to redesign territories, identify expansion markets, and make sure high-value accounts are covered by the right people.
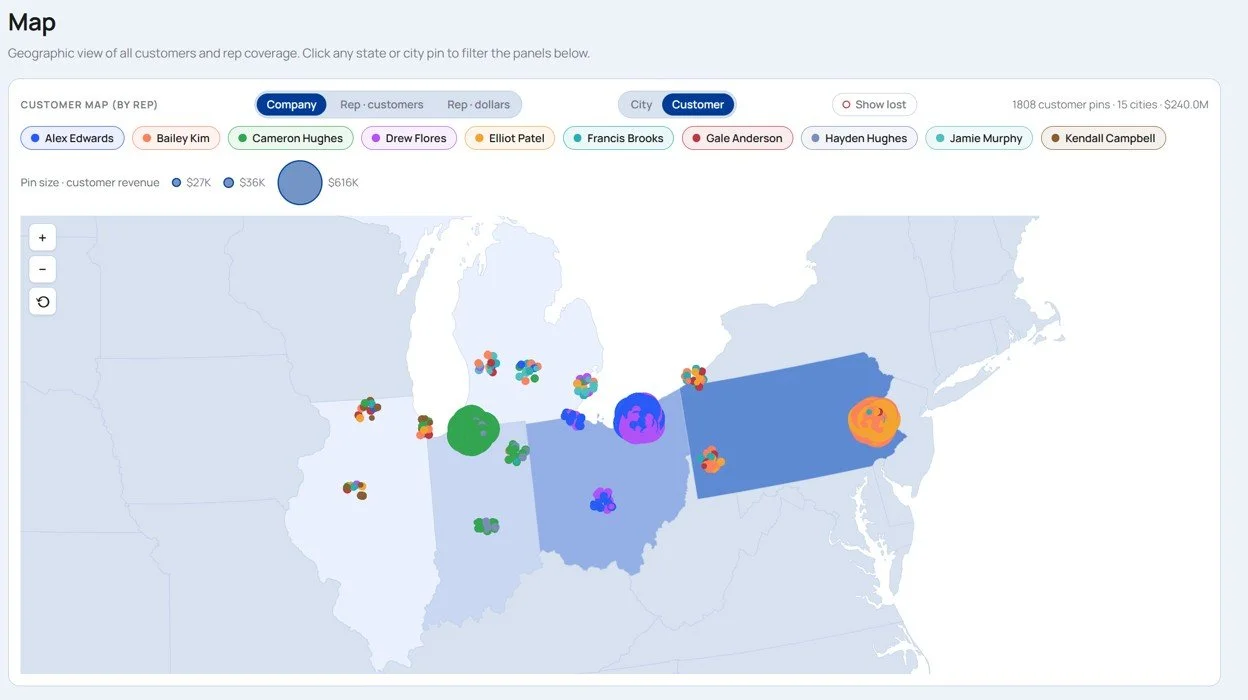
The question the Geographic Analysis answers:
Are there markets where we have customers but no real coverage — and where is our next geographic growth opportunity?
*There are 10 total Growth Levers with multiple analyses. The Geographic Coverage is just one example of a growth lever. Fill out the form below to receive more examples of SOAR Elevate reports.
SOAR Elevate 5-Year Strategic View
The 5-Year Strategic View gives every member of the leadership team a single shared picture of where the business has been and where the trend lines are heading. It combines revenue trajectory, customer base movement, average order size, and concentration risk into one dashboard — making it easy to identify whether growth is accelerating or decelerating, whether the customer base is expanding or contracting, and whether the business is becoming more or less dependent on a small number of accounts. In this example, the 31.7% CAGR tells a strong growth story — but the slowing year-over-year rate (from +40% to +23%) and the 22% customer concentration flag give leadership early signals to act on before they become problems. This view is most powerful as a shared team artifact: it ends debates about "where we are" and focuses the conversation on "what do we do next."
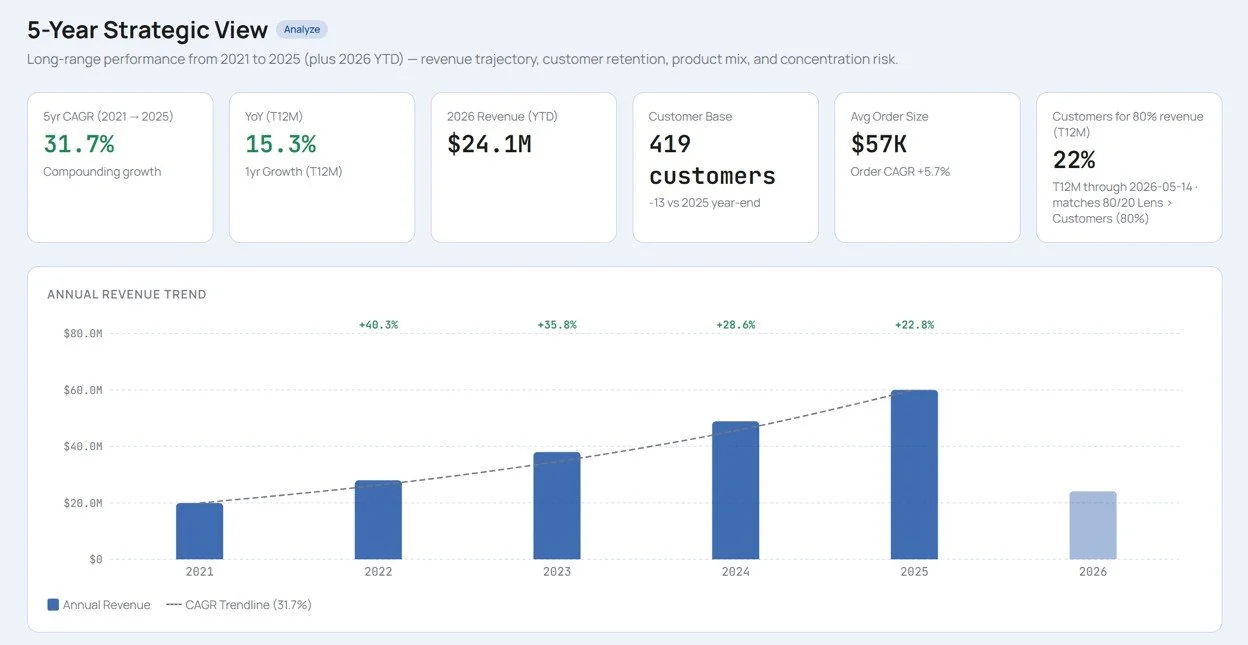
The question the 5-Year Strategic View answers:
Is our growth momentum sustainable — or are there structural risks building underneath a strong headline number?
Growth questions every leader should be able to answer
HOW MANY QUESTIONS CAN YOU ANSWER WITH CONFIDENCE?

Many companies have blind spots and don’t have access to this information.
If you answered no to 1 or more questions, you could be leaving growth on the table.

Do you know what percentage of your customer’s total spend you capture?
Can you easily identify customers whose spending has declined by 20% or more?
Do you know which lost customers you have the best chance to win back?

Can you separate market growth from company driven growth?

Are your salespeople in the right roles doing the right work?